by W.A. Steer PhD
![]()
by W.A. Steer PhD
| Back to contents | About... |
![]()
 Sonoluminescence is a little-understood phenomenon whereby light is emitted by tiny bubbles suspended in a liquid subjected to intense acoustic fields. The aim of this work was to construct apparatus to enable the observation of single-bubble sonoluminescence, to investigate its basic properties, and leave
a kit and instructions to form the basis of a future final-year undergraduate experiment. It was found that despite the apparent simplicity of the setup, to obtain successful and repeatable sonoluminescence required great care in the selection and tuning of system components, and a good degree of patience.
The precision and stability of the signal generator was found to be particularly
critical, and (if not building your own as I did) a modern digital piece of
instrumentation is highly recommended. The widely-reported increase in bubble brightness at low temperatures was readily confirmed, and a simple Mie scattering arrangement configured to monitor the bubble size gave results consistent with those already published.
Sonoluminescence is a little-understood phenomenon whereby light is emitted by tiny bubbles suspended in a liquid subjected to intense acoustic fields. The aim of this work was to construct apparatus to enable the observation of single-bubble sonoluminescence, to investigate its basic properties, and leave
a kit and instructions to form the basis of a future final-year undergraduate experiment. It was found that despite the apparent simplicity of the setup, to obtain successful and repeatable sonoluminescence required great care in the selection and tuning of system components, and a good degree of patience.
The precision and stability of the signal generator was found to be particularly
critical, and (if not building your own as I did) a modern digital piece of
instrumentation is highly recommended. The widely-reported increase in bubble brightness at low temperatures was readily confirmed, and a simple Mie scattering arrangement configured to monitor the bubble size gave results consistent with those already published.
Putterman pursued SBSL, published numerous papers, and established many of the characteristics which are now taken for granted. Once per acoustic cycle, coincident with a sharp decrease in bubble size, bluey-white light is emitted in a brief flash shorter than 100picoseconds in duration, with incredible regularity. Despite the results that have been obtained, the actual mechanism by which sound is converted to light remains elusive, not least because of the difficulty in measuring the conditions inside a pulsating bubble whose diameter is measured in micro-meters. It is generally agreed that the adiabatic compression of the bubble leads to very high interior temperatures, but beyond that, shocks, plasmas, ionisation and photo-recombination, Bremsstrahlung radiation, and even fusion are all hotly-debated possible explanations.
In Scientific American, February 1995, Putterman published an introductory overview paper on sonoluminescence together with a practical guide in the "Amateur Scientist" section of the same issue. By making the subject accessible to a wider audience, interest escalated dramatically, and given the apparent ease with which sonoluminescence could be obtained, many university groups attempted it. A revised and more detailed version of their "Amateur Scientist" guide can be found on the World Wide Web at http://www.physics.ucla.edu/~hiller/sl/, and is maintained by Robert Hiller, a student of Putterman.
Within the Physics Department here at UCL, sonoluminescence was offered last year (1996-97) as a final-year undergraduate project. Unfortunately the quest for the glowing bubble proved fruitless for those involved... a story which has been echoed by several other groups around the world. So, I was "commissioned" by the department to get the experiment up and running over the summer, ready for next year.
I too used the Scientific American article as my primary guide, but successfully "saw the light" within a couple of weeks. I found the article to be quite correct as far as it goes but that, probably due to the constraint of brevity, it fails to emphasise some significant details as much as might be desired. Combined with the somewhat optimistic impression of the ease with which sonoluminescence can be obtained, this may explain others' failed attempts and subsequent discouragement. I attribute my success to extensive experience in hands-on practical work and electronics, and ready access to a variety of electronic bits and pieces from home!
The flask was thoroughly washed, using hot water and Fairy Liquid (the original, not Lemon variety), and rinsed. The final rinse was with cold distilled water.
Three piezoelectric transducers, as described by Hiller, were supplied to us by Channel Industries Inc. The two larger transducers, 20mm diameter by 4.4mm thick (and with an 8mm diameter hole through the centre) were used as the drivers, and the smaller transducer, 6mm diameter by 2mm thick, was used as a microphone.
Lightweight hook-up wire (7/0.2mm) was cut into ~10cm lengths to make the leads for the driver transducers, and the ends stripped of insulation and "tinned" with solder. To reduce mechanical stresses on the connections the leads were coiled, by winding them around the inside tube of a biro. Three very small (approx. 2mm dia., 0.5mm high) dabs of solder were then applied to each silvered surface of the transducer, just inside the outer circumference. The exposed part of one end of each lead was cut down to a mere 2mm, and then held over a solder dab on the transducer and gently pushed down with a soldering iron for a second or so, to make the connection. Soldering was carried out quickly as the silvering on such transducers is liable to be destroyed if too much heat is used. It was also discovered that a mild electric shock can be received from the transducer during thermal expansion/contraction following soldering!
Transducers are polarised - applying a DC voltage one way round causes the ceramic to expand, while opposite polarity results in contraction. To ensure all transducers in an application can be wired in phase, they are supplied with one side marked with a red cross. By convention I wired the red sides of the transducers (with red wires) to the signal, and the reverse (with black leads) to the ground. The solder connections described were small enough that they didn't touch the surface of the flask when the transducer was held against it. Photo 2 illustrates the connection to the transducers.
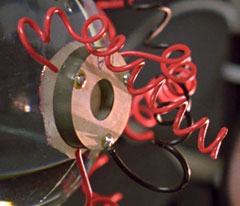
Photo 2: Wired and mounted transducer
For the small microphone transducer, the lightest grade screened audio cable was used (about 2mm outside dia.). About 4cm of outer sleeving was stripped off, and the inner covered wire and screen separately coiled. The end of the inner wire was prepared as above, and soldered to the red side of the transducer using just one tiny solder dab. The screen was soldered to the reverse.
These more rugged connections (compared to Hiller's design) didn't have any adverse effects on the acoustics.
Figure 1: Flask, showing location of transducers
Judged by eye, target positions for the transducers were marked on the flask using an OHP pen. The small transducer was to go at the very bottom of the flask, and the two larger ones diametrically opposite each other on a horizontal axis through the centre of the flask -- see figure 1.
Araldite Rapid was mixed, and a sufficient coating applied to the first transducer site on the flask. Using a three-finger clamp, the flask was then gripped with that site facing downwards. The transducer was placed on a paper towel on the side of a individual-portion breakfast-cereal packet (a "springy" support!) and working swiftly, Araldite was applied to its face. Finally the flask was lowered on to the transducer and left for 20minutes to set.
For safety reasons, the red sides of the transducers, later to be connected to the several hundred volt drive signal, were glued towards the glass where they cannot be touched.
Once the first transducer had stuck, fresh Araldite was mixed and the procedure repeated for the next driver transducer, then again for the microphone.
Piezo-ceramic transducers are the standard "loudspeaker" devices for ultrasonics but, unlike hi-fi speakers, they require several hundred volts to drive them and draw very little current. Because the piezo transducers behave electrically like capacitors, a suitable inductor can be wired in series with them to form a tuned circuit, which "matches" them to the loudspeaker-output of an audio amplifier -- see figure 2. The inductor trades current for voltage, and while presenting a low impedance to the amplifier (output swing around 40Vp-p), generates the necessary 700V or so across the transducers.
Figure 2: Piezo transducer drive circuit. The section shown in red operates at high voltage.
Figure 3: Physical wiring diagram.
The two drive transducers were wired in parallel by soldering the two red wires together, and the two black wires together. Those junctions were each soldered to the core of separate 1metre lengths of standard 50ohm coaxial cable, and the joint covered with sleeving for safety. In each case, the screening of the 50ohm cable was cut away where it emerged from the outer covering. Both the 50ohm cables, and the microphone cable, were firmly clamped to the retort stand using cable ties, to prevent tension on the connections to the transducers. BNC plugs were fitted to the other ends of the two cables, and plugged into to a junction unit linking in the 1ohm resistor and the inductor -- see figure 3. The core of the cable to black wires connects to the 1ohm resistor (current-sense), and the core of the coaxial cable to red wire to the inductor.
By keeping all the cable screens at ground potential in this way, a BNC lead from a scope could be inserted at any point in the circuit using a T-piece without causing short-circuits. The use of screened cables is essential to minimise radiation of 25kHz, which might otherwise interfere with the low level signals involved in measurements.
Given the capacitance of the transducers and the frequency at which we operate, an inductance of around 30mH is required to form a resonant circuit. The inductor needs to be made of thick enough wire to take the required current, but not so thick that it becomes physically huge, which might also lead to a fall in performance. Our "best" inductor consisted of a partially-filled 500g plastic spool of 0.5mm diameter (24swg) enamelled copper wire, tuned by sliding a ferrite rod (usually sold as MW/LW radio aerial) up and down the centre of the spool. It was found that to prevent power loss to eddy currents, owing to the large fringing field, the coil had to be sited well away from any conducting object - particularly that the axis of the coil did not intercept any nearby metal.
The wiring and coil were measured to have a DC resistance of about 10ohms (bypassing the transducers of course), and present an impedance of about 100ohms to the amplifier when tuned to resonance. It is this impedance which determines the upper limit on the power that can be transferred to the transducers given a finite voltage swing from the amplifier. In practice, we found that a mere 1Watt of power needed to be transferred to the drive circuit to achieve sonoluminescence.
The frequency was measured by connecting the separate square-wave output of the signal generator to a digital frequency counter. Note: With some waveforms and signal levels, frequency counters are liable to report wildly incorrect readings. Occasional use of a scope to check the readings are reasonable is mandatory!
* If I'd used a modern digitally-synthesised signal generator such as the Fluke/Philips PM5138A (the luxuries I now get working in an Industrial R&D lab!), then I probably would have avoided a lot of problems! - December 2004
A 100ml quickfit flask was just-over half-filled with distilled water, then heated in an electric mantle at full power, and maintained at a rolling boil for 15minutes. After switching off the heat a rubber bung was gently placed into the neck of the flask before leaving it to cool. As the water cools the bung is sucked in and leaves a vacuum above the water, preventing more gas dissolving back in. Sometimes cooling was accelerated by holding the bulb of the sealed flask under running cold water, and gently swirling its contents. With the bung kept in place, the water can remain degassed for many days if required. The procedure was repeated with a second 100ml flask, so that a quantity of over 100ml of de-gassed water was prepared.
For the experiment, the sonoluminescence flask is held in a 3-finger clamp. If the flask contained water from a previous run, then that was poured away by lifting and tilting the entire stand (not just the flask, which could lead to breakage of the wires or connections). There was a tendency for the water to gain dust, fluff, broken glass... etc., so the last of the water was always swirled out to remove any debris.
Holding the stand at about 45 degrees, the freshly-degassed, room-temperature water was poured into the sonoluminescence flask, letting it run down the side. The flask was filled to the top of the spherical part; I tried to fill so that the lowest part of the meniscus is in a position to form a continuation of the spherical shape, but a millimetre or two either side didn't seem too critical.
The microphone transducer was plugged into the oscilloscope input. As confirmation that all is well, if the scope sensitivity was turned up (and a fairly low sweep rate selected), the trace would jump if the flask was gently tapped.
The amplifier, signal generator and frequency counter were wired up and turned on. Before proceeding, the signal generator was allowed to stabilise - with my generator about 5minutes was found to be ample.
If the ferrite-rod was in the coil (inductor), it was removed at this point, before tuning up. Care was taken not to drop the rod as they are very fragile.
With the scope timebase on 10�s/div, and sensitivity on 0.1V/div., the gain control on the amplifier and/or oscillator was adjusted to get a reasonable trace on the scope. It was sometimes useful to also monitor the direct output from the amplifier on the second channel on the scope (5V/div) to ensure the waveform was not clipping (as it might if the levels are set too high).
Sweeping through the range of my signal generator (23-26.5kHz), acoustic resonances were located by watching for maximal amplitudes of the microphone signal. One was usually found near 25.5kHz and another at 25.1kHz at room temperature. It is not unusual for the waveshape from the microphone to look skewed or distorted between acoustic resonances. Confirmation that an acoustic resonance has been found is obtained by momentarily touching or gently squeezing the flask - the microphone signal level drops appreciably as the vibrations are damped.
Having located the strongest acoustic resonance, the ferrite rod was placed in the coil and slowly moved in and out to find electrical resonance, which further maximises the signal from the microphone. Because this increased the drive considerably, it was necessary to change the scope sensitivity to 1V/div.
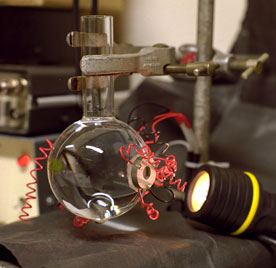
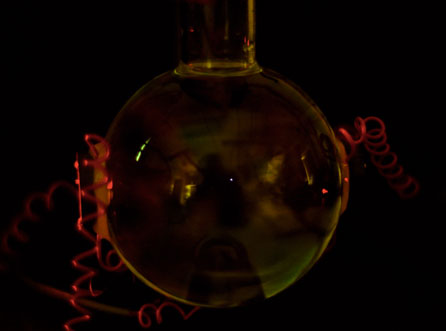
Back-lighting was used to make the tiny bubbles visible: a small torch was placed behind the flask, directed towards its centre.
With the electronics tuned up, the drive amplitude was adjusted to obtain a microphone signal somewhere between 1 and 7Vp-p. With no bubble present, the trace on the scope should be a clean sine wave.
Using a narrow, clean pipette, a small amount of water was withdrawn, the pipette tip lifted above the water surface, and the contents gently dropped back into the flask. This action induces some bubbles, and with practice, a force sufficient to generate just one or two bubbles can be judged.
At the instant the bubbles are injected, the microphone signal usually decreases in amplitude and fluctuates in waveform for a few seconds, before an equilibrium is established.
The general behaviour of the bubble at different sound levels and dissolved gas content is summarised in figure 4.
Figure 4: Dependence of bubble characteristics on sound intensity and dissolved-gas content.
Variations in the threshold levels were observed between runs, with the upper SL level lying anywhere from 3V to 7V. There are inherent practical difficulties in obtaining an accurate record of the form above - when does "a long time to dissolve" become "does not dissolve"? Repeatedly injecting bubbles will invariably lead to increase in the dissolved-gas content, perturbing the very system we are trying to measure. Despite these difficulties, the chart gives a good indication of the main characteristics, namely:
If the sound level was high, say anywhere above the upper dancing threshold, then injected bubbles were found to "stream" very rapidly to the flask centre. Above the upper SL threshold they just disappeared at the centre, while below the threshold a bubble remained after the streaming. At lower sound levels the bubbles take a more leisurely drift to the centre. Whenever the trapped bubble was lost, or could not be seeded, the sound level was adjusted, and another bubble injected.A typical description of bubble-behaviour in intermediately degassed water would run as follows:
"A level of 1 to 1.5 volts p-p on the microphone was sufficient to trap the bubble at the centre of the flask. At around 2.7 volts the bubble began to dance about the centre, spanning a distance of a couple of millimetres. With more power still, the bubble became slightly larger and "fuzzy". At 4Vp-p the jittering started to subside, and between 4.1V and 4.5V the bubble was very small, and stable. At the uppermost end of this range, the bubble visibly glowed if the room was dark. At about 4.5V the bubble suddenly disappeared altogether."
Under all circumstances, best sonoluminescence was observed when the flask was clamped as loosely as possible in the stand.
Figure 5: Ripples seen on the microphone signal when a trapped bubble is present.
The strength of the ripple depends on the exact driving frequency used, and the tightness of grip of the flask in the stand - the loosest grip gives the brightest SL bubble and largest ripple. The ripple is highly characteristic and moves along the fundamental waveform as the drive amplitude is adjusted. It moves rightwards (later in time) as the drive is increased, and when the bubble is glowing at its brightest, at the upper sonoluminescence threshold, the ripple has a peak at the centre of the crest of the main wave and also causes the trough of the wave to flatten out. The ripple appears to be a harmonic resonance of the flask, excited by the shock wave of the collapsing bubble. Hiller et al (private correspondence) have described placing a microphone in the water right next to the bubble and observing merely an instantaneous "click" at the point of collapse. When the drive is increased too far the bubble is lost and the scope trace returns to a pure sinewave -- see figure 6.
Figure 6: Ripples disappear with the bubble if the amplitude is driven too high.
If the scope trace is not steady then something is wrong, and the bubble won't glow. In this case, or just to increase the brightness further, fine adjustment of the drive frequency (up to 30Hz either way) may help. Maximising the amplitude of the ripples on the trace can be a useful guide.
In our particular flask, the 25.5kHz resonance was best at room temperature while below about 16C the 25.1kHz resonance became far better. [The temperature of the water was measured by inserting a digital thermometer probe into the water - but it was found that the probe gave bizarre readings while the sound was on.]
Qualitatively, it was observed that the bubble got much brighter when the water was cooled. Subjectively it also appeared (when back-lit) that the bubble was larger than at room temperature, though this was not confirmed.
Transducer drive: of the order of 700Vp-p swing required.
Inductor specification: around 30mH. Partially-used 500g spool of 0.5mm diameter enamelled copper wire, tuned by sliding a ferrite rod up and down the centre of the plastic spool.
Microphone output: typically between 3 and 7Vp-p for sonoluminescence. [Better guide than drive levels]
Frequency generator minimum spec.: tuneable to within 30Hz at 25kHz. Stable to within 30Hz over ten minutes or more. The output level must remain constant during adjustment of frequency, and the adjustment must be smooth with no jumping about. Watch it on a scope! My experience is that the typical generator found in an undergraduate lab is barely up to the task, though my initial success was with such an instrument.
Highly desirable: Tuneable/stable to 10Hz or better. Use a modern
digitally-synthesised signal generator (such as the Fluke/Philips PM5136 or PM5138A. Agilent also seems to have a good series of function generators (although I have no personal experience of these))
and save yourself a lot of trouble!
Flask clamp: the strength of the acoustic resonance is sensitive to the way the flask is mounted - with our three finger clamp we found that the loosest grip gave the strongest resonance and brightest sonoluminescent light. A clamp with cork 'grips' seems to work much better than one with rubber-covered fingers.
Flask resonance: the acoustic resonant frequency of the flask decreases with temperature, falling by about 300Hz from room temperature to near freezing. I actually found two resonances, at 25.5kHz and at 25.1kHz - the former was stronger at room temperature, and the latter much better below 16C. The two resonances are probably specific to our flask.
Flask temperature: the water-filled flask has a fairly large thermal mass, so temperature-induced resonance variations are quite slow. Sonoluminescence is however much brighter at the lower temperatures - below about 10C is really quite bright. Much above 20C it becomes much harder to see the glow.
Bubble size: bubbles reach an equilibrium size for a given set of parameters. Other researchers have established that a sonoluminescing bubble cycles its size between about 50microns and 0.5microns with each acoustic wave.
Flash: Putterman et al report that the upper limit on the flash duration is 100ps, and at room temperature around 106 photons are emitted in each.
Towards the end of my time on the experiment I built an op-amp amplifier for a BPX65 high-speed photodiode, and encased the diode and amplifier in a small die-cast box for electrical screening. With a solid-state laser beam focused on the bubble using a 2" focal length eye-glass, scattered light was collected by a 1" focal-length lens and focused onto the photodiode. Output from the diode amplifier was fed to an oscilloscope, giving a trace of scattered light intensity. With the well-focused beams, optical alignment was quite tricky, and results correspondingly variable. Nevertheless, it proved the idea and equipment worked, and excellent (qualitative) plots of bubble radius vs. time were obtained -- see figure 7. These results were completely consistent with those published by Hiller et al. With more time, careful setting up, and calibration, quantitative measurements could be taken, and relationships of bubble-size against water temperature, gas content, or drive level etc. could be investigated.
Figure 7: Oscilloscope traces showing: 1 the signal from the microphone attached to the bottom of the flask, and 2 photodiode signal for laser light scattered by the bubble (relating to bubble radius). I would like to emphasise that the Mie scattering results shown are obtained from a single acoustic cycle, and they are real data - not some theoretical best fit!!!
Consistent with published results, the brightness of sonoluminescence was seen to increase as the drive level was increased, and as the water was cooled. Regrettably, but for largely logistical reasons, a photomultiplier or similar device for quantitatively measuring bubble intensity was not employed in this study. Despite its simplicity, the Mie scattering configuration set up in the final days of the project gave extremely promising results, with plots of bubble size against time being in almost exact agreement with those of Hiller et al., save for an absolute scale. With a little more care in setting up and alignment, and overcoming the problem of the bubble changing its position in the flask as the acoustic drive is increased, the measurements could be made quantitatively and more easily. This would enable the relation of bubble-size to water temperature, as well as drive-level, to be investigated.
Altogether I am confident that the requirements of the project brief have been excelled, with a reliable sonoluminescence apparatus constructed, the initial problems overcome, major characteristics verified -- and a great deal of expertise gleaned! I await with interest the results of subsequent studies.
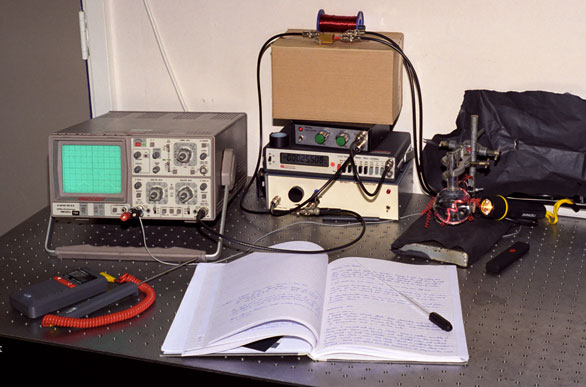
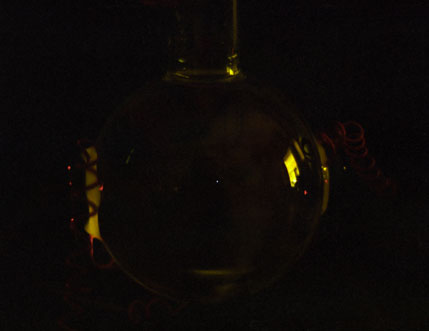
Figure I: Definition of peak-to-peak voltage measurement
The peak voltage is half the peak-to-peak, and for a sinewave, the r.m.s. voltage is 1/sqrt(2) times Vpk. Therefore,
Vrms = Vp-p / (2 sqrt(2)) .
Assuming the voltage and current flowing in a circuit are in phase, the power dissipated is equal to the product of r.m.s. current and r.m.s. voltage.
Hence
Power = Vp-p x Ip-p / 8 .
When the voltage and current are displaced in phase, for example the high-voltage side of the transducers, driven through the inductor, a phase factor would have to be used to calculate power. Failure to correct for phase shifts in calculation usually leads to the false result that an unrealistically large amount of power is consumed.
Reports are abound (on the Internet etc.) that sonoluminescence requires at least an 100/200/300... Watt amplifier. In fact typically only ONE watt is dissipated in the transducers/drive system during sonoluminescence. More "powerful" amplifiers are really only being used to overcome bad matching by brute force, by providing more raw voltage swing - it's not the available power that counts!
Because the relation between amplifier output and acoustic energy in the flask is so dependent on the drive and its tuning up, I always quote the sound level in terms of microphone level - which directly indicates the sound level in the flask.
![]()
The junction between the inductor and transducers will exhibit a potential of order 250V AC (25kHz) when the system is tuned up and at sonoluminescing levels. Take care not to touch anything at this point in the circuit when the volume is up! The 'live' side of the transducers are connected with a red wire, and the corresponding silvered side of the transducer is stuck towards the flask. DO NOT transpose the drive wires at the BNC connections, otherwise the EXPOSED side of the transducers will become 'live'. Similarly, avoid touching the tips of the spare red wires from the transducers, and the live connection to the inductor - they deserve some respect!
We always knew the available electrical drive with the set-up described was only just sufficient, but we have since found that a "universal-type 100V line transformer" can be used successfully to help match the output- impedance of the amplifier to the inductor/transducer circuit: if more power is required (and remember you can have too much power!), connect the amplifier output between the "speaker" side 0v and 4ohm connection, and connect the inductor to the 8- or 16ohm connection - with the transducer or 1ohm resistor going to the 0v connection... all on the same side of the transformer (we're using it as an autotransformer). Don't touch the other side of the transformer (the 100V-line side) as these windings will exhibit a very high voltage when the circuit is energised.
The transducer set are available from:
Channel Industries
839 Ward Drive
Santa Barbara
California
Tel: [US] (805) 967 0171
Fax: [US] (805) 683 3420
©1997-2005 William Andrew Steer